A Bright Future Ahead
Portable Spectral Services Announces Exciting Management Transition
Micro-XRF technology provides unique access to a scale of contextual chemistry that has previously not been widely utilised in industry. The instrument provides chemical information mapped at a multi-micron scale for samples up to 20cm in length (Fig 1). This has its advantages as it bridges the gap between the restricted small scale of Scanning Electron Microscopy (SEM), and generalised whole rock analysis at the meter scale.

Figure 1. Scale of micro-XRF observations.
The Bruker M4 TORNADO micro-XRF has an X-ray beam spot size of ~25 μm with variable resolution. The resolution at which a sample is scanned refers to the space between analysis points. The higher the resolution, the more defined the image, the lower the resolution the grainier the image. Increasing the resolution will of course increase the time taken to collect the scan data. Therefore, it is critical to be selective when deciding what resolution a sample is scanned at, to ensure the necessary detail is captured while optimising the time and cost of analysis.
When setting the scan parameters in the M4 TORNADO software, the resolution can be customised based on the chemical information required from the sample. A resolution can be selected from 4 μm to >300 μm. So how do you choose the resolution for your sample short of plucking a number out of thin air? This will depend on what question you are asking of the sample and therefore what scale is important.
When looking at the distribution and interaction between dominant phases in a sample over an area greater than a few centimetres, the required detail can be captured at a resolution starting from around 100 μm. Figure 2 shows the detail that can be seen in a 2.5 cm2 sample as the resolution in increased from 50 μm to 300 μm. As the resolution increases, the main phases are consistently identified, however the definition of the phase boundaries and subtle variations within the phases is lost.

Figure 2. Change in observed detail in single element distribution maps with decreasing resolution for a centimetre scale analysis.
However, if the question is associated with the elemental distributions within a single phase or at the boundary of two phases, the contextual scale can change from centimetres to millimetres. In this scenario, using a higher resolution on a smaller area provides a different scale of detail and information. Figure 3 shows the detail that can be achieved when looking at the elemental distributions within a single mineral grain approximately 2 mm in diameter.

Figure 3. Change in observed detail in single element distribution maps with increasing resolution for a millimetre scale analysis.
So, what do you do if you do not necessarily know what to expect in your sample? In this case, we recommend doing a preliminary scan of the main sample area at a lower resolution (~100 μm) to gain initial insight into the chemistry of the sample (Fig. 4). This scan not only provides valuable information about the whole sample, but then helps to direct the focus of investigation where key areas of interest can be identified for detailed high-resolution analysis of small areas, saving both time and money!

Figure 4. distribution map of a low-resolution scan at 100 µm with a small target area re-scanned at a high resolution of 10 µm.
For more information on micro-XRF spectroscopy visit www.microxrf.com.au/. For more information on the Bruker M4 TORNADO micro-XRF visit here.
If you are interested in having your own sample analysed by micro-XRF, contact Portable Spectral Services at [email protected]

Portable Spectral Services Announces Exciting Management Transition

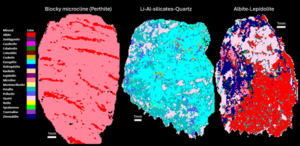
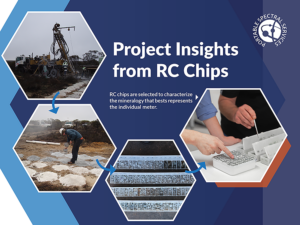
Our tool introduces uXRF (micro-X-ray fluorescence) scanning technology to RC chip analysis, enabling rapid, non-destructive, and quantitative analysis of major, minor, and trace mineral phases.

Automated micro-X-ray fluorescence (micro XRF) technology emerges as a powerful tool to rapidly and accurately capture the mineralogy of rock chip, RC and AC samples.

Findings of an ongoing regional evaluation study over concealed Proterozoic lithologies known to host magmatic nickel sulphides with potential to host other base-metal, gold and rare earth elements (“REE”) systems within the Fraser Range, Western Australia.

Findings of an ongoing regional evaluation study over concealed Proterozoic lithologies known to host magmatic nickel sulphides with potential to host other base-metal, gold and rare earth elements (“REE”) systems within the Fraser Range, Western Australia.

Findings of an ongoing regional evaluation study over concealed Proterozoic lithologies known to host magmatic nickel sulphides with potential to host other base-metal, gold and rare earth elements (“REE”) systems within the Fraser Range, Western Australia.
